1. Upload Chromatogram:
.ab1 or .scf files accepted2. Set Chromatogram Options:
Note: Chromatogram will update live to reflect changes.3. Enter Reference Sequence:
Example Data: Click Results Tab to see results.
Created by the Yost Lab yost.genetics.utah.edu
Hosted by Rstudio
Using sangerseqR version
Overview
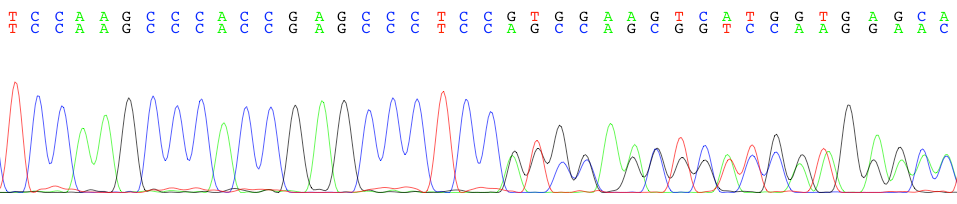
This is a web-based tool to parse Sanger sequencing chromatograms with double peaks into wildtype and alternative allele sequences. Sequencing results parsed by this tool should have a region with single peaks followed by a region with double peaks (see chromatogram above). Sequencing results with more than two peaks, including those that occur due to multiple priming will not work. The single peak region is used to align the sequencing results to the provided reference to calculate the appropriate offset. The double peak region is then separated into wildtype and alternative allele sequences and aligned to each other. Both the alternative sequence and the alignment are returned to the user.
PolyPeakParser can be run locally using the sangerseqR bioconductor package. If you are familiar with Rstudio, you can run it by installing the package and running the PolyPeakParser() function.
PolyPeakParser is under active development. Please direct questions or problem reports to Joseph Yost at jyost@genetics.utah.edu
Citation
Hill JT, Demarest BL, Bisgrove BW, Su YC, Smith M, Yost HJ. (2014) Poly Peak Parser: Method and software for identification of unknown indels using Sanger Sequencing of PCR products. Developmental Dynamics. PMID: 25160973
Interface
All inputs and parameters are set using the panel to the left. There are also three output tabs (Instructions, Chromatogram and Results). As each input is entered or parameter set, the Chromatogram and results tabs will automatically be updated to reflect the most relevant information. The user can also click on each tab to view any of the information he/she would like.
Results
A chromatogram of the sequence data, the reference and alternative alleles and their alignment will be returned to the user.
Step-by-step Instructions
1. Upload Data:
Upload a chromatogram file generated from Sanger (chain termination) sequencing. Sequence data should have a low background with at least 30 bases of single peak region. This region is used to align the sequencing data with the reference sequence. Chromatograms of mixed products showing more than two peaks at a single position will not work. Currently, ABIF (.ab1) and SCF (.scf) files are supported. SCF is an open standard and several tools exist to convert other formats to SCF files.
2. Set Chromatogram Options:
After the data is uploaded, a chromatogram will automatically appear, if it does not, click on the "Chromatogram" tab. This chromatogram will update as the following parameters are adjusted.
5' Trim
Number of bases to remove from beginning of sequence data. This parameter should be set so that the low quality reads at the beginning of the sequence have been removed, but as much of the remaining sequence as possible is left.
3' Trim
Number of bases to remove from end of sequence data. This parameter should be set so that the low quality reads at the end of the sequence have been removed. When the sequencing results span an entire PCR product, you will see a region of single peaks after the double peak region as a result of one product being longer than the other. This region should also be removed.
Show Trimmed Region
Optionally shows the trimmed regions. Trimmed regions are marked with red lines.
Signal Ratio Cutoff
A value between 0 and 1. Higher numbers are more stringent. The ratio of the signal for each base to the maximum signal is calculated at each position. Only peaks whose ratio is greater than the set cutoff are called. Peaks with signals less than this fraction are considered noise. For example, the default value of .33 means that only peaks with signals greater than 1/3 of the max signal ratio are considered. The user should use the live updating chromatogram to set this value below the level of the true peaks, but above the noise. The top row of base calls shows the base with the maximum signal at that position. The second row contains the base calls, including ambiguous bases, for peaks with signals above the set cutoff. These can be used as a guide for setting the parameters. There will likely be a range of numbers that yields the same result.
3. Enter the Reference Sequence
This is the reference allele for the sequenced region. The beginning and end do not have to align with the sequencing results, but should preferably encompass the sequenced region. For large deletions, the sequenced region may extend far beyond the length of the sequencing results, so the downstream region should also be included if this is suspected. Numbers and other invalid DNA characters (anything other than A, C, G, T, R, Y, S, W, K, M, B, D, H, V and N) will automatically be removed, so sequences can be copied from Genbank or other file types that include numbers, spaces, etc.
Acknowledgements
R
R Core Team (2013). R: A language and environment for statistical computing. R Foundation for Statistical Computing, Vienna, Austria. URL http://www.R-project.org/.
Biostrings
H. Pages, P. Aboyoun, R. Gentleman and S. DebRoy. Biostrings: String objects representing biological sequences, and matching algorithms. R package version 2.30.0.
knitr
Yihui Xie (2013). knitr: A general-purpose package for dynamic report generation in R. R package version 1.5.
shiny
RStudio and Inc. (2013). shiny: Web Application Framework for R. R package version 0.8.0. http://CRAN.R-project.org/package=shiny
A Chromatogram will be shown here when a valid sequencing file has been uploaded.
The Alternate Allele and Alignment will be shown here after a data file and reference sequence have been entered.